结核与肺部疾病杂志 ›› 2021, Vol. 2 ›› Issue (2): 125-130.doi: 10.3969/j.issn.2096-8493.2021.02.007

• 论著 • 上一篇    下一篇

堪萨斯分枝杆菌肺病与肺结核空洞CT征象对比分析

周碧霞, 袁功玲(), 曾令武, 朱怡, 程晰, 李敏, 吴妹英   

  1. 215131 苏州大学附属传染病医院 苏州市第五人民医院
  • 收稿日期:2021-05-17 出版日期:2021-06-30 发布日期:2021-07-01
  • 通信作者: 袁功玲 E-mail:yxkygl123@163.com
  • 基金资助:
    苏州市卫生和计划生育委员会科技项目(LCZX201819)

Comparative analysis of CT signs of Mycobacterium kansasii pulmonary disease and pulmonary tuberculosis

ZHOU Bi-xia, YUAN Gong-ling(), ZENG Ling-wu, ZHU Yi, CHENG Xi, LI Min, WU Mei-ying   

  1. the Affiliated Infectious Hospital of Soochow University, the Fifth People’s Hospital of Suzhou, Suzhou 215131, China
  • Received:2021-05-17 Online:2021-06-30 Published:2021-07-01
  • Contact: YUAN Gong-ling E-mail:yxkygl123@163.com

摘要:

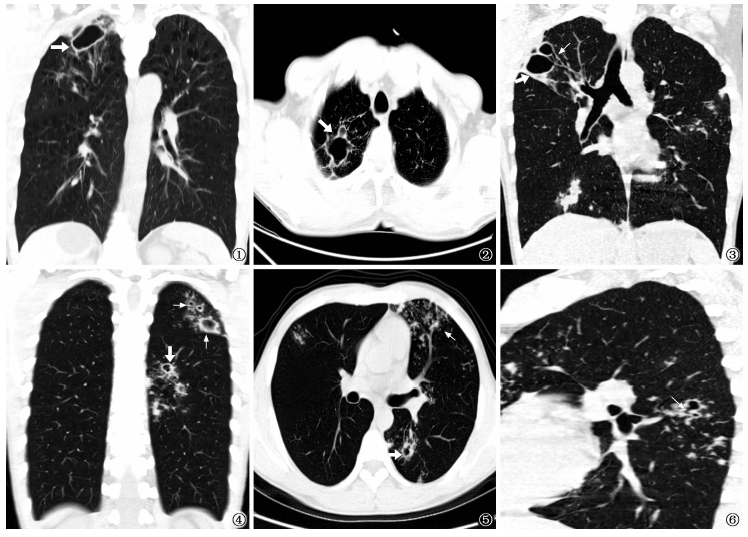
目的 分析堪萨斯分枝杆菌肺病空洞与肺结核空洞CT征象异同。方法 采用回顾性分析方法,搜集2018年1月至2020年6月经苏州市第五人民医院临床及实验室检查确诊,肺部有空洞病灶的45例堪萨斯分枝杆菌肺病患者作为观察组;搜集同期确诊肺结核且有肺部空洞病灶的50例患者作为对照组。收集两组研究对象肺部空洞病灶的数量、累及肺叶范围、分布位置、形状、大小、壁厚、内外壁光整情况、内容物及周围结构等影像资料,进行比较分析。结果 观察组45例患者共出现60个空洞,对照组50例患者共出现75个空洞。观察组出现3个及以上空洞者的比例[2.2%(1/45)]明显低于对照组[14.0%(7/50)],差异有统计学意义(χ2=4.26,P=0.039)。观察组在右肺上叶的空洞发生占比[70.0%(42/60)]明显高于对照组[36.0%(27/75)];分布于外带空洞占比[91.7%(55/60)]明显高于对照组[58.7%(44/75)];不规则空洞占比[25.0%(15/60)]明显高于对照组[2.7%(2/75)],差异均有统计学意义(χ2值分别为15.42、18.56、15.11,P值均为0.000)。观察组空洞壁厚[中位数(四分位数):2.3(0.9,8.3)mm]明显低于对照组[3.6(1.0,10.8)mm],差异有统计学意义(U=-4.34,P=0.000)。观察组空洞内壁光整比例[85.0%(51/60)]明显低于对照组[96.0%(72/75)],外壁光整比例[85.0%(51/60)]多于对照组[57.3%(43/75)],差异均有统计学意义(χ2值分别为4.98和12.07,P值分别为0.026和0.001)。观察组空洞周围卫星灶发生率[38.3%(23/60)]明显低于对照组[70.7%(53/75)];空洞邻近胸膜增厚发生率[91.7%(55/60)]明显高于对照组[69.3%(52/75)],差异均有统计学意义(χ2值分别为14.16和10.11,P值分别为0.000和0.001)。结论 堪萨斯分枝杆菌肺病的空洞病灶与肺结核空洞在CT征象方面具有一定差异,可以为临床诊断提供依据。

关键词: 分枝杆菌,堪萨斯, 分枝杆菌,结核, 肺疾病, 体层摄影术,螺旋计算机, 对比研究

Abstract:

Objective To analyze the similarities and differences of CT signs of cavity due to Mycobacterium kansasii lung disease and pulmonary tuberculosis. Methods A retrospective study was conducted, 45 patients with cavity due to Mycobacterium kansasii lung disease diagnosed by clinical and laboratory examinations of Suzhou Fifth People's Hospital from January 2018 to June 2020 were selected as the observation group; 50 patients with cavity due to pulmonary tuberculosis of the same period were selected as the control group. The image signs, such as number of cavities in the lungs, the extent of pulmonary lobes involved, the distribution location, shape, size, wall thickness, internal and external wall smoothing, contents and surrounding structures, of the two groups were compared and analyzed. Results A total of 60 cavities appeared in 45 patients in the observation group, and there were 75 cavities appeared in 50 patients in the control group. The proportion of patients with 3 or more cavities in the observation group was significantly lower than that of the control group (2.2% (1/45) vs. 14.0% (7/50), χ 2=4.26, P=0.039). In the observation group, the proportions of cavities in the upper lobe of the right lung and in the outer zone were both significantly higher than those in the control group (70.0% (42/60) vs. 36.0% (27/75), χ 2=15.42, P=0.000; 91.7% (55/60) vs. 58.7% (44/75), χ 2=18.56, P=0.000); the proportion of irregular voids was significantly higher than that in the control group ((25.0% (15/60) vs. 2.7% (2/75), χ 2=15.11, P=0.000). The cavity wall thickness of the observation group was significantly lower than that of the control group (M(Q1,Q3), 2.3 (0.9, 8.3) mm vs.3.6 (1.0,10.8) mm, U=-4.34, P=0.000). In the observation group, the smoothing ratio of the inner wall of the cavity was significantly lower than that of the control group (85.0% (51/60) vs. 96.0% (72/75), χ 2=4.98, P=0.026), and the ratio of smoothing the outer wall was more than that of the control group (85.0% (51/60) vs. 57.3% (43/75), χ 2=12.07, P=0.001), the incidence of satellite foci around the cavity was significantly lower than that in the control group (38.3% (23/60) vs. 70.7% (53/75), χ 2=14.16, P=0.000); the incidence of pleural thickening adjacent to the cavity was significantly higher than that in the control group (91.7% (55/60) vs. 69.3% (52/75), χ 2=10.11, P=0.001). Conclusion There were differences in CT signs between the cavity lesions of Mycobacterium kansasii lung disease and the cavities of tuberculosis, which could provide a basis for clinical diagnosis.

Key words: Mycobacterium kansasii, Mycobacterium tuberculosis, Lung diseases, Tomography, spiral computed, Comparative study